
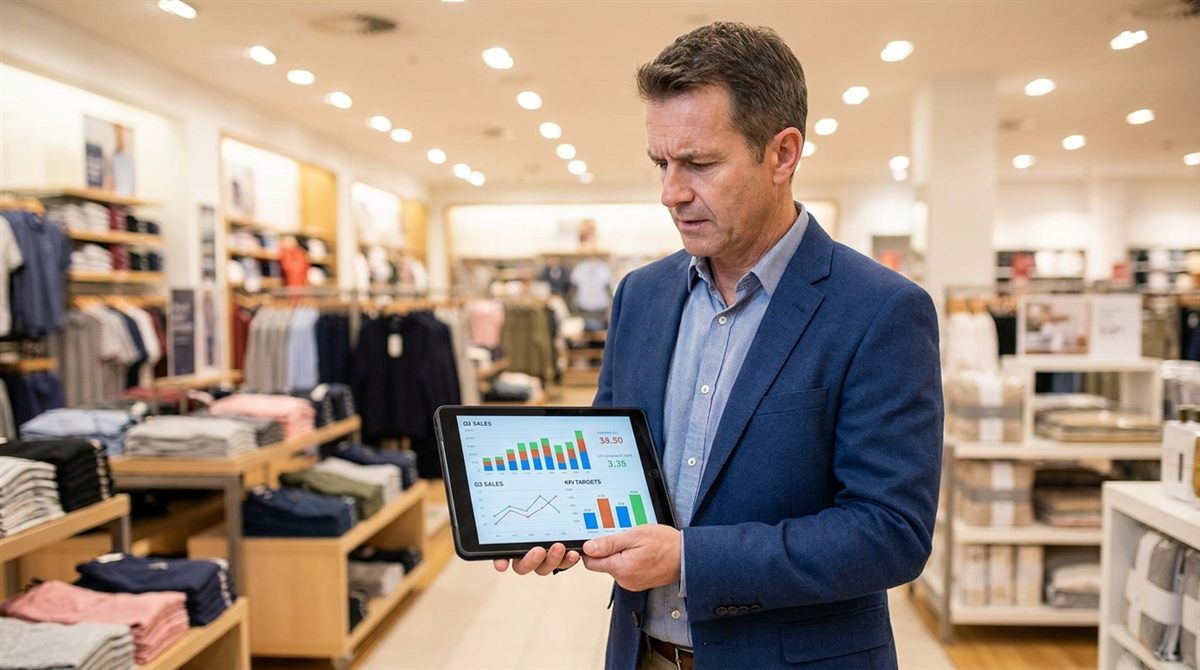
Running a store gives you no shortage of numbers — but more numbers isn't the same as more clarity. The retailers who grow steadily aren't the ones tracking everything; they're the ones watching a handful of the right retail KPIs and acting on them. A KPI (key performance indicator) is simply a metric tied to a goal: it tells you, at a glance, whether the business is moving in the right direction.
Below are the seven retail KPIs that matter most for store owners in 2026 — what each one means, why it matters, and how to keep an eye on it without drowning in spreadsheets. (New to this? Start with our primer on turning POS data into better decisions.)
1. Sales by category and hour
Total sales tell you how much; sales broken down by category and by hour tell you where and when. This is the foundation of every other decision — what to stock, when to staff, and when to promote.
Why it matters: Knowing that a category drives a third of your revenue, or that one three-hour window makes your day, changes how you buy and schedule. How to track it: a sales-by-hour chart and a category breakdown, reviewed weekly.
2. Gross margin
Gross margin is the percentage of each sale you keep after the cost of the goods: (Revenue − Cost of Goods Sold) ÷ Revenue. It's the difference between being busy and being profitable.
Why it matters: Two products can sell equally well but earn wildly different profit. Watching margin — overall and by category — keeps you focused on what actually pays. How to track it: margin by product and category, so you can push high-margin lines and reprice thin ones.
3. Inventory turnover
Inventory turnover measures how many times you sell through and replace your stock in a period: Cost of Goods Sold ÷ Average Inventory. It shows how hard your cash is working.
Why it matters: Low turnover means money tied up in shelves instead of the bank. High turnover means healthy demand and fresh stock — but too high can signal you're running out. How to track it: turnover by category, with slow-movers flagged for markdown or delisting.
4. Sell-through rate
Sell-through is the share of received stock you actually sell in a period: Units Sold ÷ Units Received, as a percentage. It's especially useful for new products and seasonal buys.
Why it matters: A low sell-through rate tells you an item was over-ordered or mispriced before it becomes dead stock. How to track it: review sell-through a few weeks after any new or seasonal order lands.
5. Shrinkage
Shrinkage is inventory you paid for but can't sell — lost to theft, damage, spoilage, or simple counting errors. It's usually measured as a percentage of sales.
Why it matters: Shrinkage comes straight off your bottom line. Even a percentage point or two is real profit walking out the door. How to track it: compare expected stock (from sales) against counted stock, and watch the categories where the gap is widest.
6. Average basket size
Average basket size (or average transaction value) is your revenue divided by the number of transactions. It tells you how much the typical customer spends per visit.
Why it matters: Growing basket size lifts revenue without needing a single extra customer — through smart bundling, placement, and upsells. How to track it: monitor the trend over time and test whether promotions actually raise it.
7. Sales per employee
Sales per employee divides revenue by staff hours or headcount. It's your simplest read on labor efficiency — one of the biggest costs in any store.
Why it matters: It shows whether your staffing matches demand. Pair it with sales-by-hour and you can schedule people where they generate the most value. How to track it: revenue per labor hour, compared against your busiest periods.
The 7 KPIs at a glance
- Sales by category & hour — what and when you sell
- Gross margin — what you actually keep
- Inventory turnover — how hard your cash works
- Sell-through rate — how well stock moves
- Shrinkage — what you lose before selling
- Average basket size — spend per visit
- Sales per employee — labor efficiency
Turning KPIs into a weekly habit
KPIs only work when you look at them regularly — and that's where most store owners fall off. Pulling seven metrics from your POS by hand every week is a chore that quietly gets dropped. The answer isn't more discipline; it's automation.
A retail dashboard puts all seven KPIs in one place, updated automatically from your POS and inventory systems. That's what Retaillytics does — it centralizes your data and tracks sales, margin, inventory, and performance in real time, so your weekly review takes minutes, not hours.
Success starts with measuring the right metrics. Track a focused set of KPIs consistently, and the decisions almost make themselves.
Pick the KPIs above that map to your goals, review them on the same day each week, and let a dashboard handle the number-crunching. Consistency — not complexity — is what turns metrics into growth.
Keep reading
Why Accurate Purchase Orders Keep Your Inventory Honest
A purchase order is the record behind your stock counts and margins. Here is how one entry error spreads — and why automating POs keeps your inventory honest.
Read More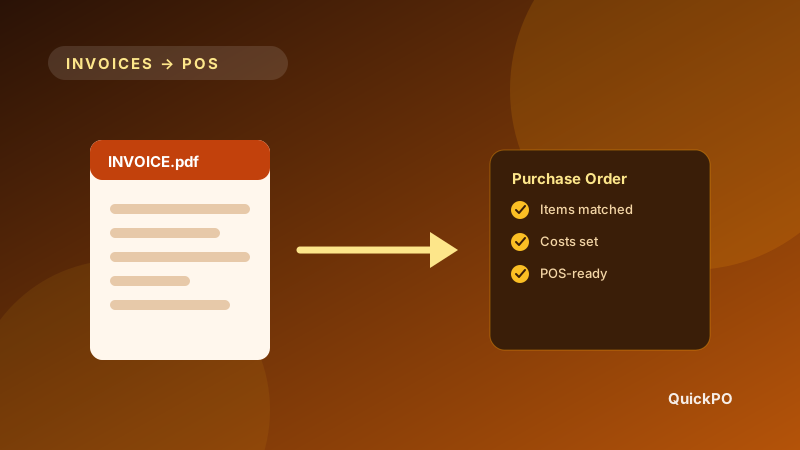
PDF Invoices to POS in Minutes: A Beverage Retailer's Guide
Beverage retailers lose hours retyping vendor invoices. Here is how to turn PDF invoices into POS-ready purchase orders in minutes instead.
Read MoreTrack every KPI in one dashboard
Retaillytics brings your most important retail metrics together in real time — see how it works with a quick demo.
Get a Demo