
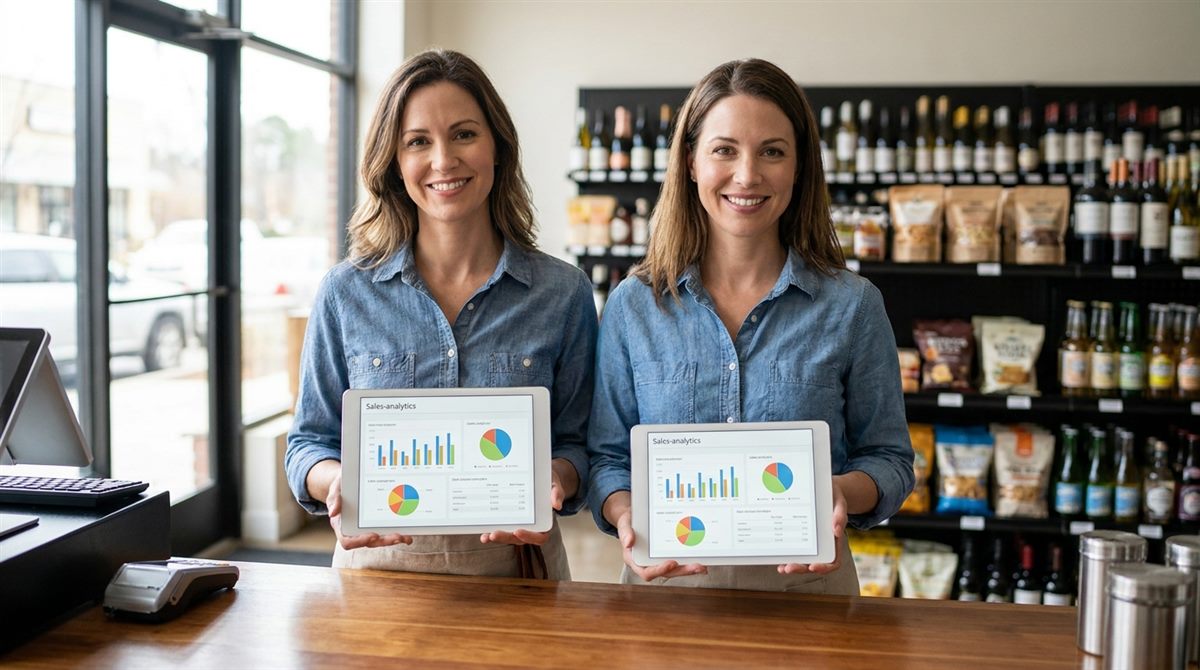
Every time your store rings up a sale, it creates a small record: what sold, when, for how much, and how the customer paid. Multiply that by hundreds of transactions a day and your point-of-sale system is quietly building one of the most valuable assets your business owns — a detailed history of exactly how your store makes money. The problem is that for most retailers, that data just sits inside the POS, never looked at again. Retail analytics is simply the practice of turning that raw sales data into decisions you can act on.
You don't need a data scientist or a huge budget to start. You need to know which questions to ask and where the answers live. This guide breaks down what retail analytics really means, why your POS data is worth so much, and how to move from spreadsheets to confident decisions.
What is retail analytics?
Retail analytics is the process of collecting, organizing, and interpreting data from your store — sales, inventory, customers, and operations — to understand what's happening and decide what to do next. In plain terms, it answers three questions: What happened? Why did it happen? And what should we do about it?
Good analytics turns a vague feeling ("weekends feel busy") into a fact you can plan around ("Saturdays between 4–7pm drive 28% of weekly revenue"). That shift — from gut feel to evidence — is where the money is.
Why your POS data is the asset you're ignoring
Your POS already captures nearly everything you need, for free, as a byproduct of doing business:
- Sales — every item, quantity, price, discount, and timestamp.
- Products — which SKUs and categories move fast, and which gather dust.
- Payments — cash vs. card mix, and how that affects your fees and cash flow.
- Timing — the hours, days, and seasons when demand peaks and dips.
The catch is that raw POS exports are hard to read. A 5,000-row spreadsheet doesn't tell you a story — it hides one. Retail analytics is about surfacing that story so you can see it in seconds instead of squinting at columns.
The four questions good retail analytics answers
1. What's actually selling — and what isn't?
Ranking products and categories by units and revenue instantly shows your winners and your dead stock. That single view tells you what to reorder, what to promote, and what to stop carrying so you can free up shelf space and cash.
2. When do customers really buy?
Sales-by-hour and sales-by-day patterns tell you when to schedule your best staff, when to run promotions, and when to take deliveries. Staffing your busiest hours properly is one of the fastest ways to lift both sales and customer experience.
3. Which products make you money — not just revenue?
A high-revenue product with a thin margin can earn you less than a quieter product with a healthy markup. Analytics that pair sales with margin show you where the real profit is, so you can push the items that actually pay the bills.
4. Where is money leaking?
Excessive discounting, inventory shrinkage, and slow-moving stock quietly drain profit. When you can see these leaks in a report instead of discovering them at year-end, you can plug them while it still matters.
Key takeaways
- Your POS already collects the data you need — the value is in reading it.
- Focus on four questions: what sells, when, what's profitable, and where money leaks.
- Pair sales with margin, not just revenue, to find your real winners.
- A dashboard beats a spreadsheet because it shows the story, not just the rows.
From data to decision: three quick examples
Analytics only matters if it changes what you do. A few everyday examples:
- Reordering: A category report shows your top 20 SKUs drive 60% of sales — so you tighten stock on the long tail and never run out of the winners.
- Staffing: Sales-by-hour reveals a 5–8pm rush — so you move a shift and cut lines during your most profitable window.
- Pricing: A margin view flags a popular item you've been under-pricing — a small, informed increase lifts profit without hurting demand.
Common mistakes retailers make with their data
- Only watching total revenue. Revenue can rise while profit falls. Always look at margin alongside it.
- Reviewing numbers once a year. Trends you catch monthly are opportunities; trends you catch at tax time are regrets.
- Living in spreadsheets. Manual exports are slow, error-prone, and quickly abandoned. Automation is what makes analytics stick.
- Tracking everything. A handful of the right metrics beats a hundred you never read. (See our guide to the 7 retail KPIs every store owner should track.)
You don't need a data team — you need the right dashboard
The reason most retailers never use their data isn't laziness; it's friction. Exporting, cleaning, and charting POS data by hand is a job nobody has time for. The fix is a platform that does it automatically.
That's exactly what Retaillytics is built for. It pulls data straight from your POS and other systems, then turns it into clear, interactive dashboards — sales by hour and category, payment mix, top products, and the KPIs that matter — updated in real time. Instead of wrestling with rows, you see what's happening at a glance and act on it.
Data is only valuable when it's easy to understand. The goal isn't more reports — it's faster, more confident decisions.
Retail analytics doesn't have to be complicated. Start with the four questions above, watch the right metrics, and let a dashboard do the heavy lifting. The store that reads its numbers will always outrun the one that guesses.
Keep reading
Why Accurate Purchase Orders Keep Your Inventory Honest
A purchase order is the record behind your stock counts and margins. Here is how one entry error spreads — and why automating POs keeps your inventory honest.
Read More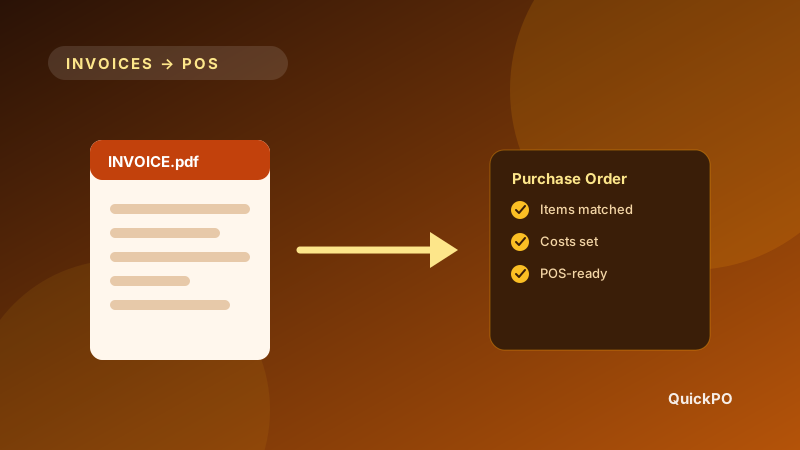
PDF Invoices to POS in Minutes: A Beverage Retailer's Guide
Beverage retailers lose hours retyping vendor invoices. Here is how to turn PDF invoices into POS-ready purchase orders in minutes instead.
Read MoreTurn your POS data into decisions
See how Retaillytics turns your sales and inventory data into dashboards you'll actually use — book a quick demo with our team.
Get a Demo